
8. Basic Operation
Streszczenie: Podstawowa obsługa ID2000 w IDMVS: układ okna głównego i panelu konfiguracji, wybór trybu pracy (Test, Normal, Raw), podgląd odczytu kodów i historia odczytów.
EN: ID2000 basic operation in IDMVS: main window and configuration wizard panel, operation modes (Test, Normal, Raw), code reading preview and history record.
Dotyczy: przemysłowy czytnik kodów Hikrobot serii ID2000 (typy I–VII; Fast Ethernet, USB lub RS-232; obsługa przez klienta IDMVS i kody konfiguracyjne)
Źródło: dokumentacja producenta (Hikrobot ID2000 Series Industrial Code Reader User Manual); tabele i uwagi przepisane z obrazów na tekst; opisy rysunków – opracowanie Multiprojekt
8.1 Client Software Layout
The main window of the client software is displayed after the device is connected to the client software.
Note:
- The graphic user interface may differ by different versions of client software you use.
- Refer to the user manual of the client software for detailed operation guide.
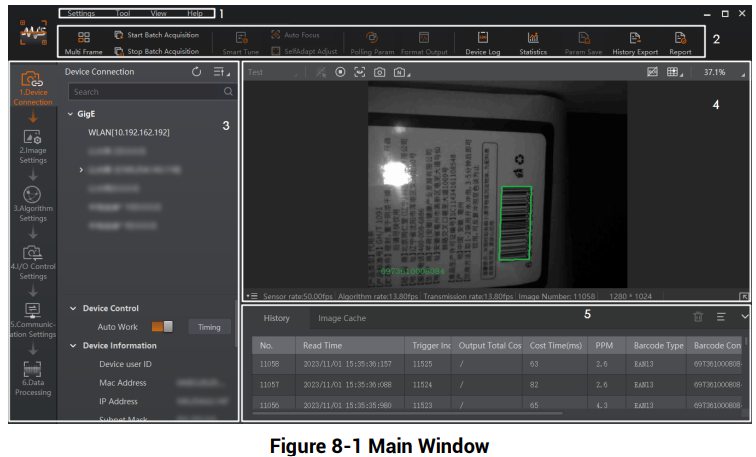
Figure 8-1 Main Window
Figure description (text version): Main window of the client: 1 – menu bar and 2 – control toolbar at the top, 3 – device configuration wizard panel on the left (device list, device control, device information), 4 – live view window with a code image in the middle, 5 – history panel with the code reading list at the bottom. See Table 8-1.
Table 8-1 Main Window Description
| No. | Name | Description |
|---|---|---|
| 1 | Menu Bar | Provides access to function modules including Settings, Tool, View, and Help. |
| 2 | Control Toolbar | Provides access to functions such as starting/ending batch acquisition, switching the window division mode, viewing real-time statistics during acquisition, and viewing device logs, and quick access to tools such as Smart Tune, Auto Focus, and SelfAdapt Adjust. |
| 3 | Device Configuration Wizard Panel | The wizard for device configurations. In the Device Information field, you can view information about a device and its corresponding network interface. You can connect device(s) to the software, manage devices by groups, and configure parameters related to image settings, algorithm settings, I/O control settings, communication settings, data processing, and configuration management. |
| 4 | Live View Window | Displays the live video of the selected device(s). |
| 5 | History Panel | Displays the code reading history of device(s). You can also view the real-time reading results during acquisition. |
The device configuration wizard panel and control toolbar help you perform some basic operations of the device
Table 8-2 Device Configuration Wizard Panel Description
| No. | Module Name | Description |
|---|---|---|
| 1 | Device Connection | You can connect or disconnect a device, modify the device IP address, view device information, etc. |
| 2 | Image Settings | You can set image parameters, light parameters, etc. |
| 3 | Algorithm Settings | You can add different code types, set code number, etc. |
| 4 | I/O Control Settings | You can set parameters related to input and output. |
| 5 | Communication Settings | You can select different communication protocols, and set parameters for the output result. |
| 6 | Data Processing | You can set the filter rule for the output result. |
| 7 | Configuration Management | You can save and load user parameters, and restart the device. |
8.2 Basic Operation
Steps
- Go to the left corner of live view window, and select the operation mode.
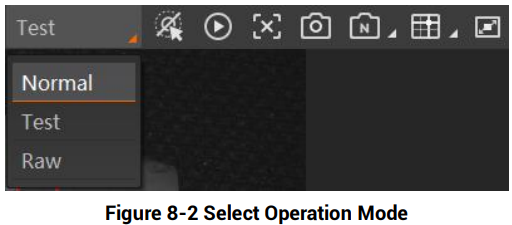
Figure 8-2 Select Operation Mode
Figure description (text version): Live view toolbar with the operation mode drop-down list opened in the top-left corner, showing the options Normal, Test and Raw.
Note: Stopping the real-time acquisition is required before selecting the operation mode.
Table 8-3 Operation Mode Description
| Device Mode | Description |
|---|---|
| Test Mode | It is used during device debugging. The device outputs images that are acquired in real time, and displays code information. |
| Normal Mode | It is used during device normal operation. After reading codes in the image, the device outputs the image and code information. |
| Raw Mode | It is used during testing image data. The device outputs raw data and displays code information. |
- Click
 in the live view window to view images and the code reading effect.
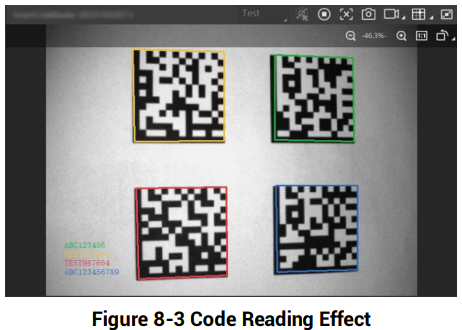
Figure 8-3 Code Reading Effect
Figure description (text version): Live view window showing four DataMatrix codes, each outlined with a coloured frame after successful reading; the read results are listed in the bottom-left corner of the image.
Note: If the effect is not very good, you can adjust the focus knob (type II and type III devices only) or use the auto focus function (type I device only), or adjust related parameters like exposure time, gain, etc. in the Image Settings area.
- (Optional) Go to history panel to view codes recognized by the device.
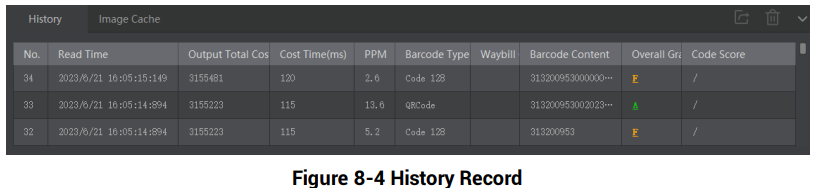
Figure 8-4 History Record
Figure description (text version): History panel (History / Image Cache tabs) with columns No., Read Time, Output Total Count, Cost Time (ms), PPM, Barcode Type, Waybill, Barcode Content, Overall Grade and Code Score; three Code 128 and DataMatrix entries.
Słowa kluczowe
Hikrobot ID2000, IDMVS, main window, configuration wizard, control toolbar, operation mode, Test mode, Normal mode, Raw mode, live view, history record, tryb pracy
No comments to display
No comments to display